Pets by the numbers
Data and statistics on pet ownership, community cats and shelter populations in the United States
Understanding the data
Obtaining accurate statistical data about pets in the United States has improved significantly thanks to advancements in software products for shelters and rescues, research-based surveys and Shelter Animals Count, the most trusted data source for shelter and rescue animals in the U.S. Below, you’ll find the best available data for owned pets, shelter pets, pets living in underserved communities and community cats.
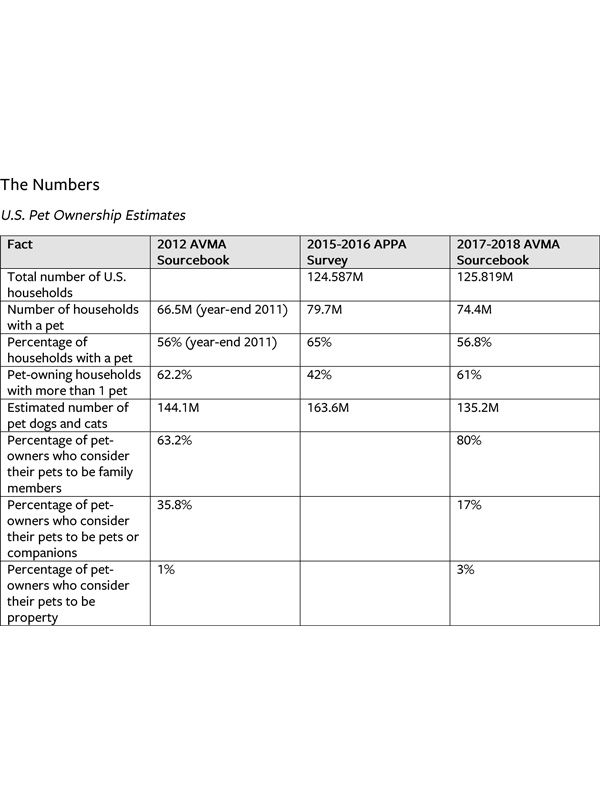
The numbers
| Fact | 2025 AVMA Pet Ownership and Demographics Sourcebook | 2025 APPA Strategic Insights from the National Pet Owner Survey |
|---|---|---|
| Number/percentage of households with a pet | Any pet: 77.5M (58.6%) Dog: 56.3M (42.6%) Cat: 43.1M (32.6%) | Any pet: 94M (71%) Dog: 68M (51%) Cat: 49M (37%) |
| Total number of pet dogs and cats | Dogs: 87.3M Cats: 76.3M |
| Fact | 2025 AVMA Pet Ownership and Demographics Sourcebook | APPA's Dog & Cat 2024 Report |
|---|---|---|
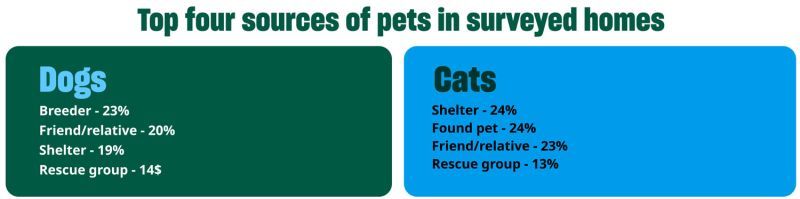
| Dogs adopted from an animal shelter/humane society or rescue group, or from a rescue event at a pet store | 9.4% (shelter) 9.7% (rescue) 7.4% (rescue event at pet store) | 19% (shelter) 14% (rescue) |
| Cats adopted from an animal shelter/humane society or rescue group, or from a rescue event at a pet store | 9.6% (shelter) 7.6% (rescue) 6.7% (rescue event at pet store) | 24% (shelter) 13% (rescue) |
| Dogs found roaming | 4.9% | |
| Cats found roaming | 23.3% | 24% |
| Dogs acquired from friends or relatives | 25.3% | 20% |
| Cats acquired from friends or relatives | 24.7% | 23% |
| Dogs purchased from a pet store | 9.1% (independent pet store) 3.8% (chain pet store) | |
| Cats purchased from a pet store | 7.5% (independent pet store) 3.5% (chain pet store) | |
| Dogs purchased from a breeder | 18.4% | 23% |
| Cats purchased from a breeder | 4.6% | |
| Dogs bred at home/from owned pet | 2.9% | |
| Cats bred at home/from owned pet | 3.7% | |
| % of dogs received as a gift | 4.4% | |
| % of cats received as a gift | 3.3% |
Pet ownership estimates in underserved communities
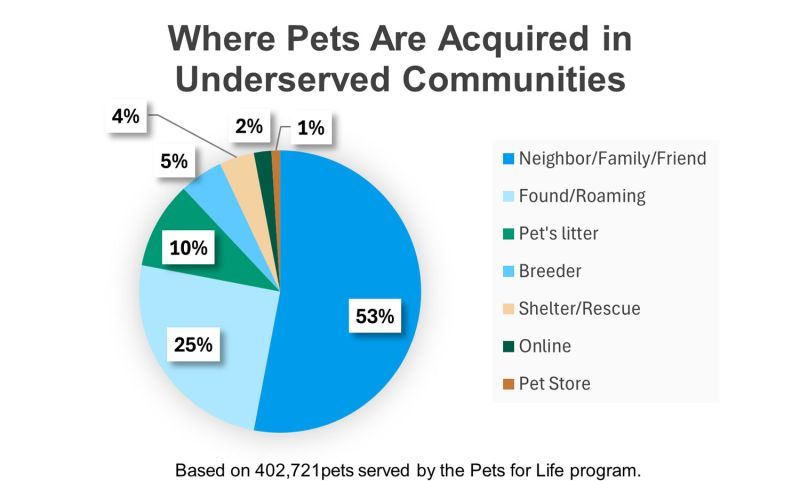
While the above figures tend to reflect pet owners who have traditional access to veterinary care and pet services, the Pets for Life program of Humane World for Animals has collected data from hundreds of thousands of people and pets experiencing poverty and living in underserved communities.
- Pets living in underserved communities in the U.S.: 20 million
- Percentage of pets living in underserved communities who are not spayed or neutered: 88%
- Percentage of pets living in underserved communities who have never seen a veterinarian: 70%
The rate of unaltered pets and pets who have not seen a veterinarian is not due to a lack of interest or love, but rather highlight an extreme inequity in access to veterinary care, spay/neuter providers and other services. Pets for Life data also shows that people in underserved communities are far more likely to acquire a pet from a friend, neighbor or family member.
People in underserved areas are natural rescuers, they just aren't part of the formal sheltering system as fosters and adopters. But they are an audience that opens their hearts and homes to animals when the need arises. Shelters would have a lot more animals if the animals were not taken in by community members. This also is the flip side to the stereotypes of underserved communities not caring as much about animals or having more animal cruelty.
Learn more about our Pets for Life program.
Community cat estimates
Cats can be divided into three populations—those who are personal pets, those being cared for by shelters and rescues, and those who live in our communities. Community cats are friendly stray or abandoned cats as well as feral (unsocialized) cats and cats who fall somewhere in between. These cats are unowned, but may be provided with food, water and/or shelter by caring individuals. Humane World for Animals advocates for a trap-neuter-return approach to humanely managing community cats.
- Estimated number of community cats in the U.S.: 30 to 40 million
- Percentage of community cats who are spayed/neutered: Unknown (this will vary by community based on implementation of community cat management strategies)
- Average number of litters produced by an intact female community cat: 1.4 litters/year
- Mean number of kittens in each litter produced by intact community cats: 3 kittens/litter
- Estimated survivorship of community kittens, 0-6 months: 25%
- Estimated annual survivorship of adult community cats: 70%
- Percentage of people who believe leaving a community cat outdoors is preferable to having the cat caught and euthanized: 81%
- Percentage of people in the U.S. providing food for community cats: 29% (ranges from 15%-47% based on community)
Learn how to help community cats.
Shelter and rescue group estimates
Accurate data from shelters and rescue groups has been historically difficult to obtain because each organization may use different definitions of key terms and different methods for collecting data. In addition, under-resourced shelters and rescues may not have the technology or ability to share their data nationally.
Since 2012, Humane World for Animals has been working with a wide variety of stakeholders to change this through Shelter Animals Count, the trusted source for collecting and sharing credible and accessible data on animal intakes, outcomes and pet owner support programs. Thousands of municipal and private shelters and rescues automatically submit data to Shelter Animals Count through their shelter software systems, enabling insights that will save lives and keep more pets with their families. In addition, technological advances allow Shelter Animals Count the ability to accurately forecast trends in animal sheltering, allowing Humane World and others an opportunity to address challenges ahead of time. Organizations can also use data from Shelter Animals Count to reliably estimate the total numbers of animals who enter or receive services from shelters and rescues:
| Pet | # entering shelters annually | % who entered shelters and rescues as lost pets | % who were relinquished by their owners | % adopted | % euthanized in shelters annually | % of lost pets entering shelters who are returned to owner |
|---|---|---|---|---|---|---|
| Cats & Dogs | 5,789,000 (down 2% compared to 2024) | 59% (down 1% compared to 2024) | 30% (up 1% compared to 2024) | 70% (down 5% compared to 2019) | 10% (down <1% compared to 2024) | 11% |
| Cats | 2,963,000 (up <1% since 2024) | 60% | 30% | 74% | 9% (up 1% compared to 2024) | 3% |
| Dogs | 2,877,000 (down 14% since 2019) | 56% | 30% | 67% | 11% (down <1% compared to 2024) | 19% |
Source: Shelter Animals Count 2025 Annual Analysis
*Numbers from Shelter Animals Count’s “other” category (which includes cruelty cases, transfers, born in care, etc.) are not included; therefore, these numbers don’t add up to 100%.
Document